See the operation clearly.
Adapt fast.
Build toward real control.
TSRB Production Intelligence gives manufacturers faster, more flexible, and more accurate operational visibility. It turns machine, labor, routing, and production signals into dynamic dashboards and actionable intelligence—then creates a direct path to MERIT 2.0 for full operational governance.
Positioning
PI and MERIT 2.0 each have a distinct role
Production Intelligence is the visibility and intelligence layer. MERIT 2.0 is the control, enforcement, and governance layer. That distinction makes the story stronger: PI solves the need for fast, flexible insight today, while preparing the plant for closed-loop operational governance tomorrow.
Production Intelligence
- Real-time machine, labor, and production visibility
- Dynamic dashboards and fast custom reporting
- Flexible modeling for real-world manufacturing complexity
- Broad integration across ERP, QMS, maintenance, and custom systems
MERIT 2.0
- Governed work queues, ownership, and escalation
- Hard gates, holds, proof, and verification logic
- Corrective action and learning-loop enforcement
- Closed-loop operational governance across functions
Core strengths
Why Production Intelligence stands apart
PI is designed to reflect how shops actually run: changing conditions, mixed resources, shifting priorities, parallel work, and stakeholders who need answers now—not tomorrow.
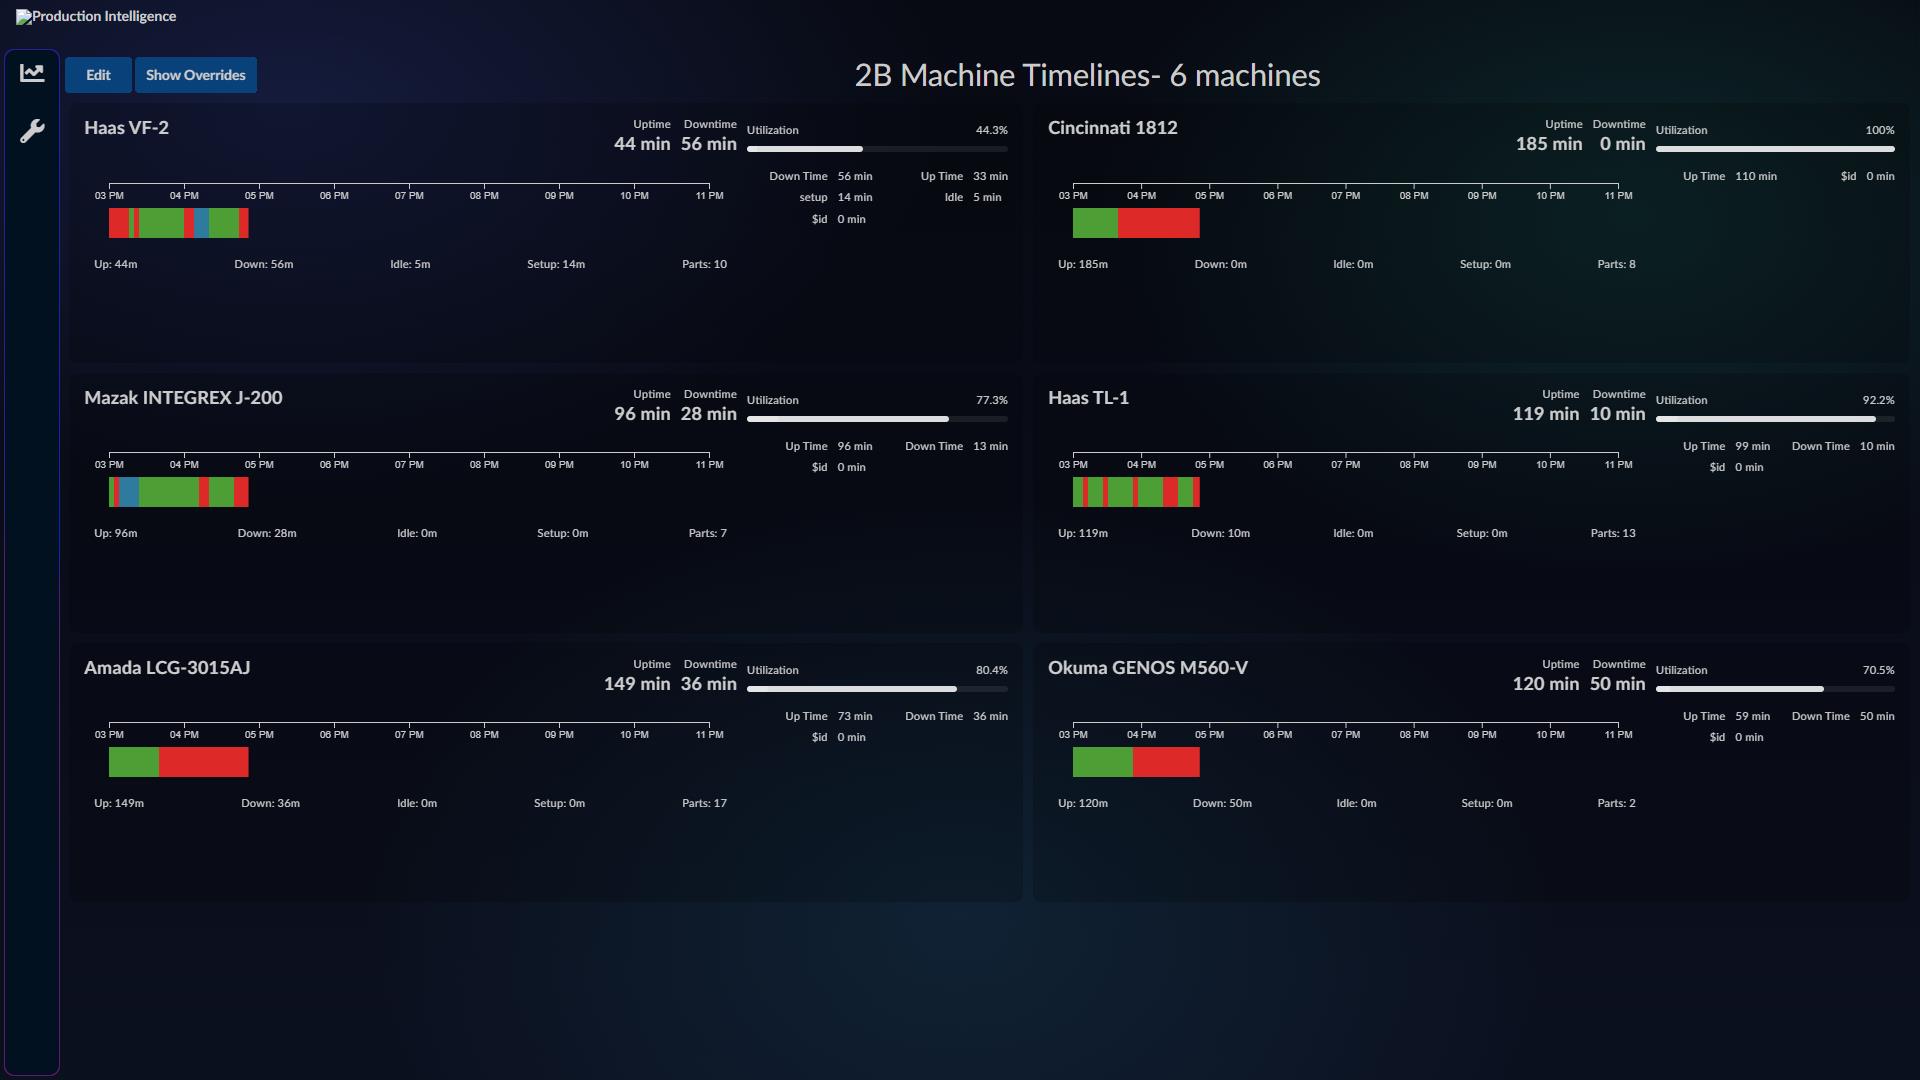
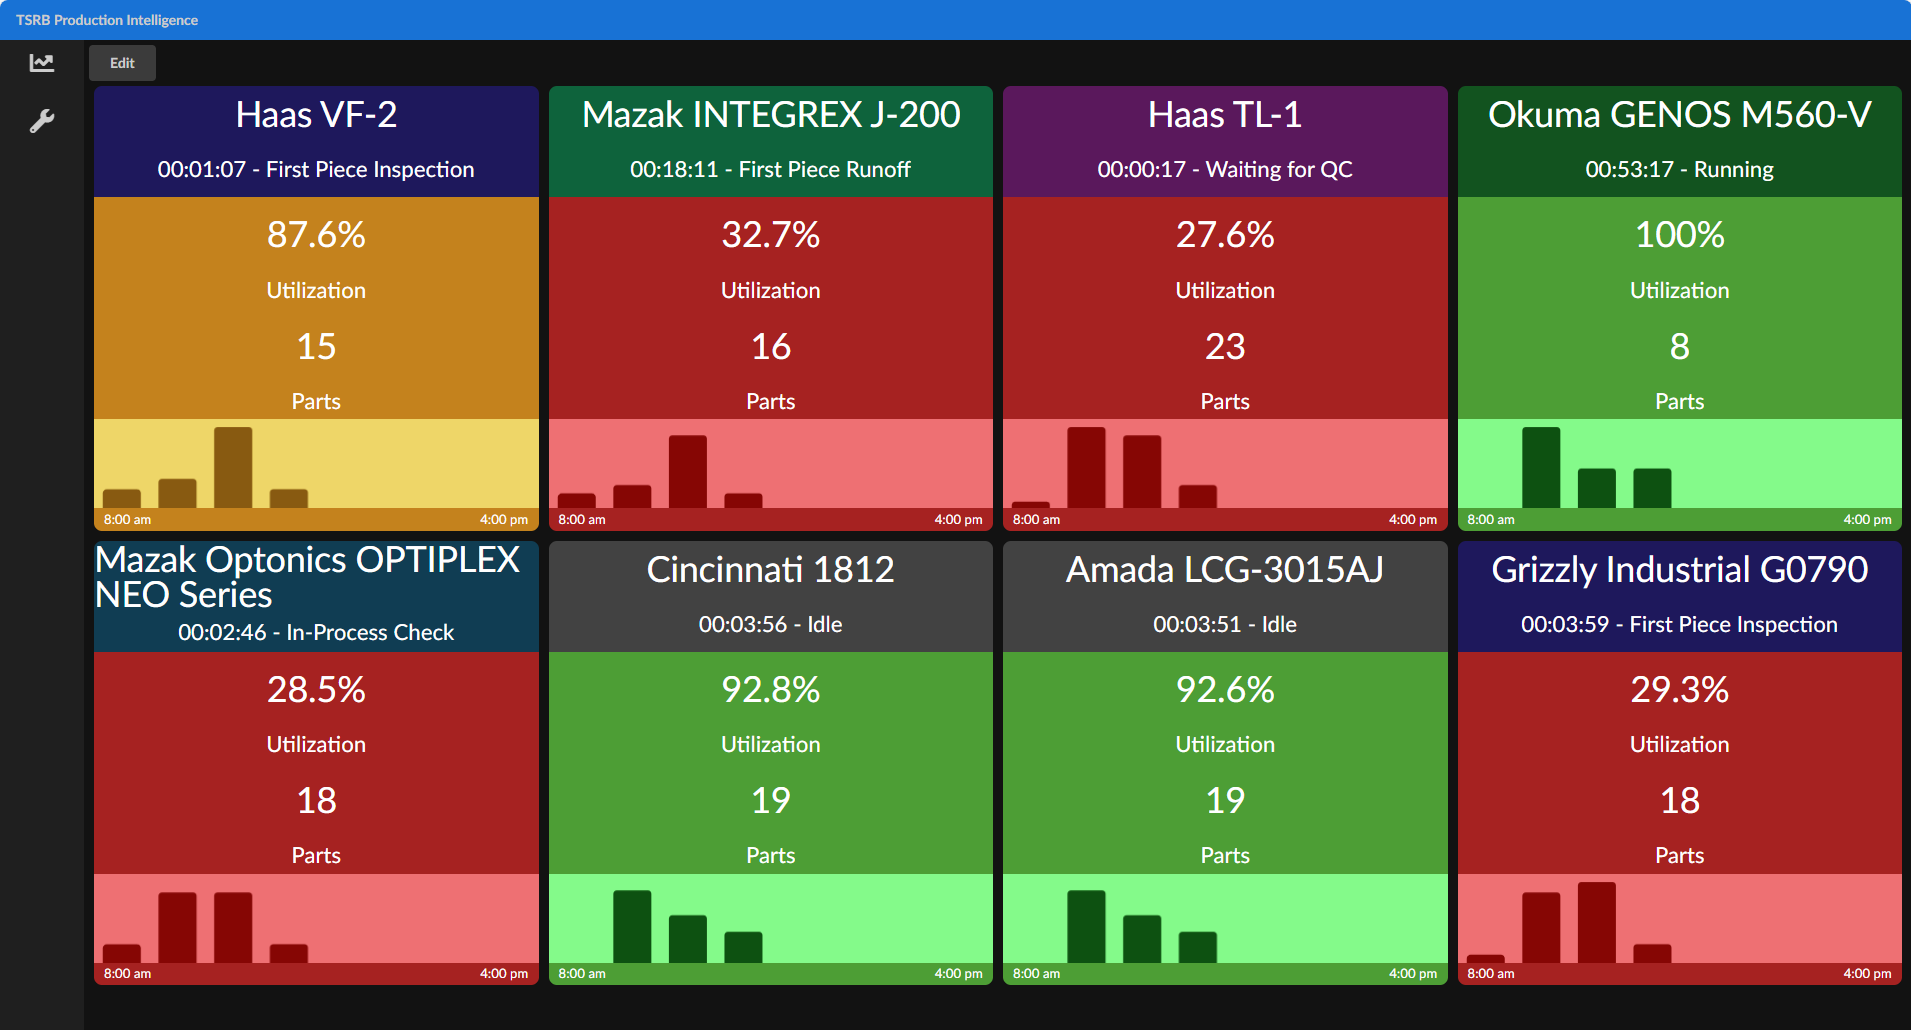
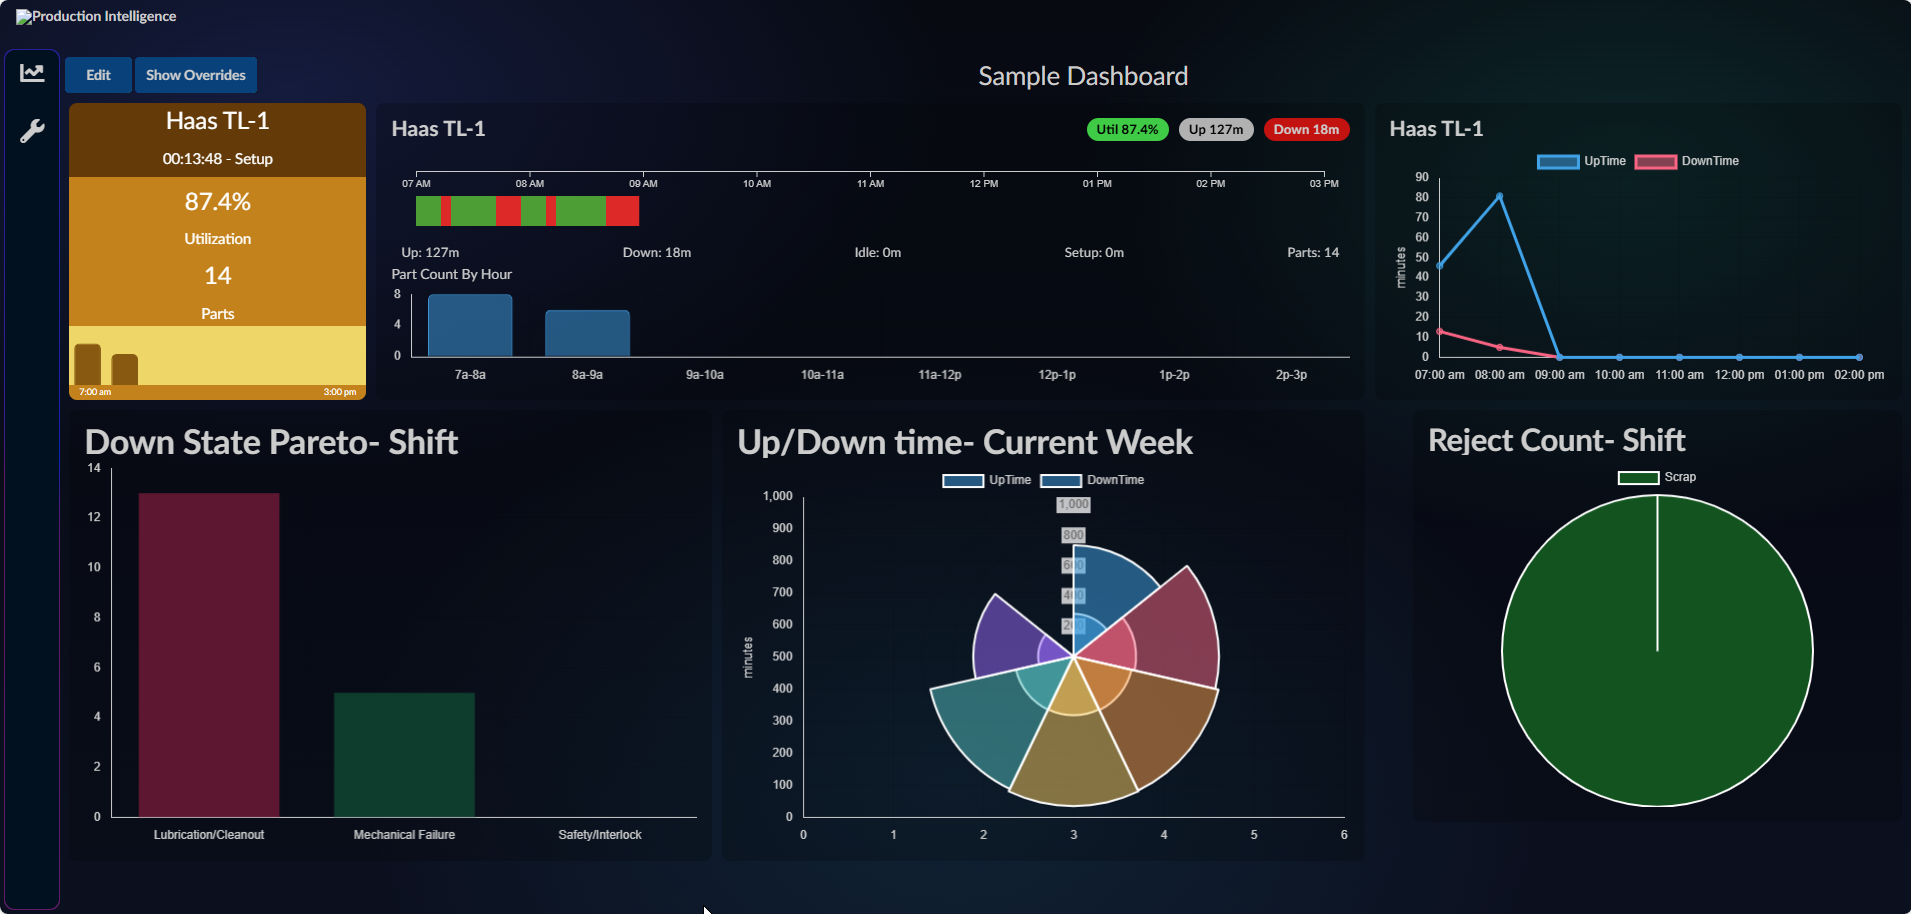
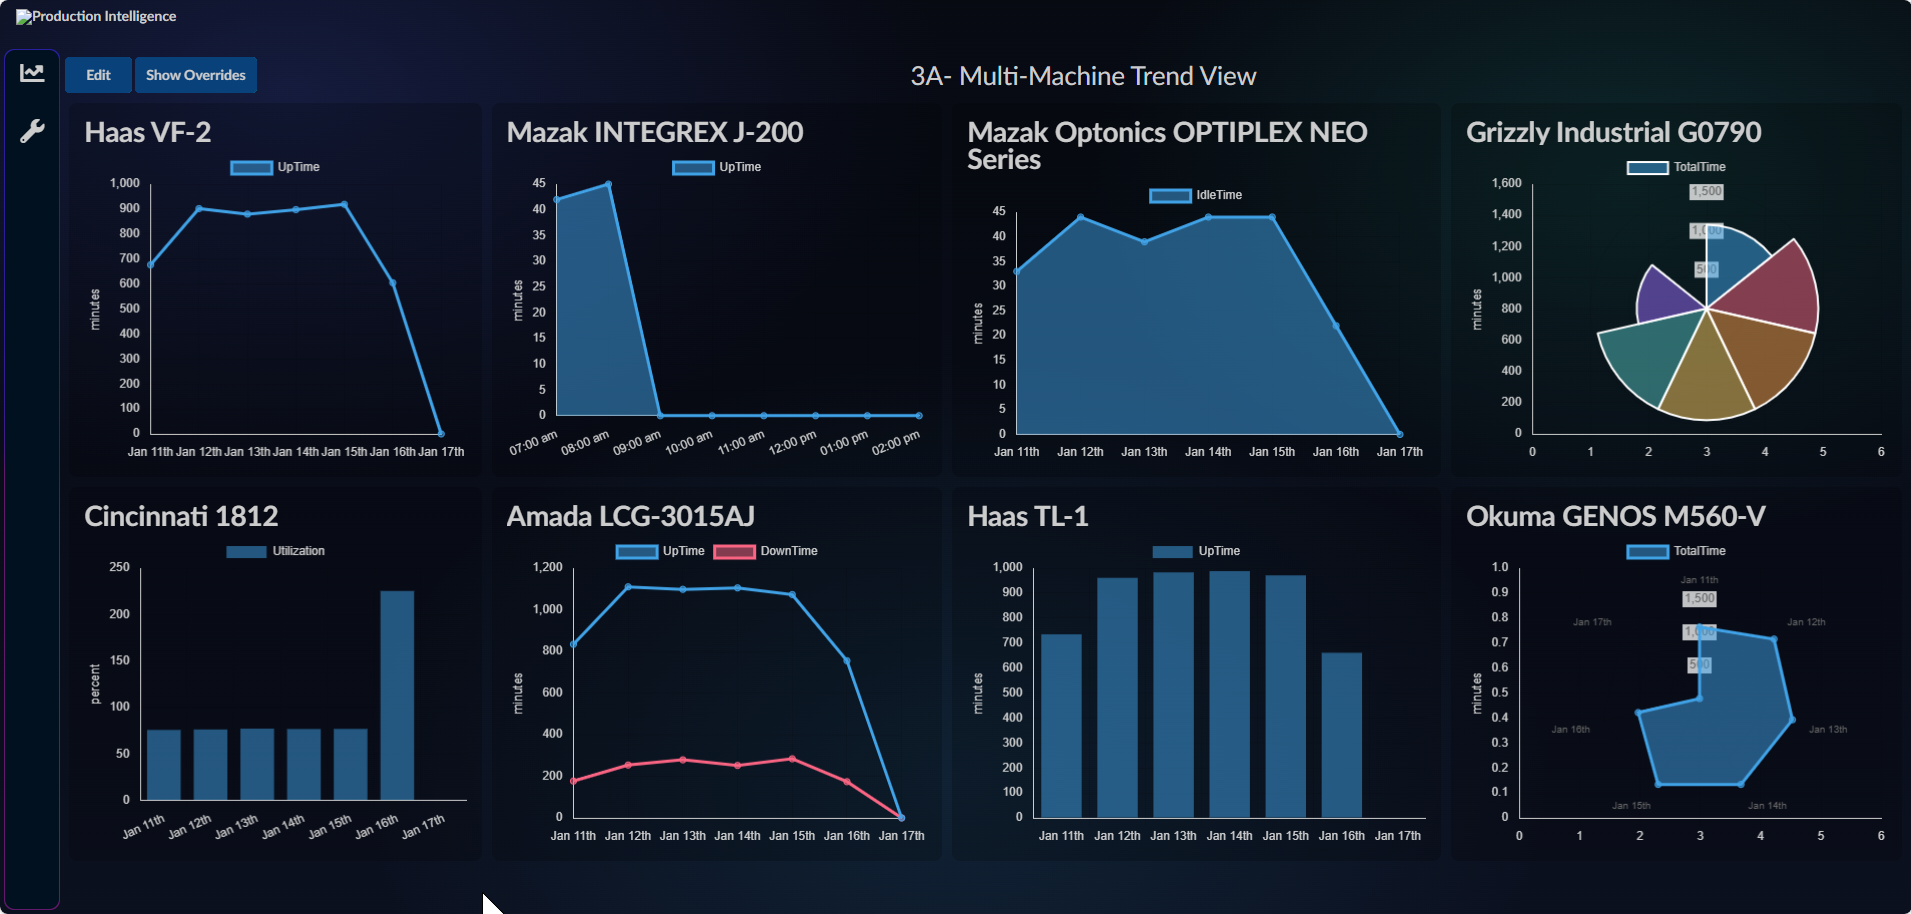
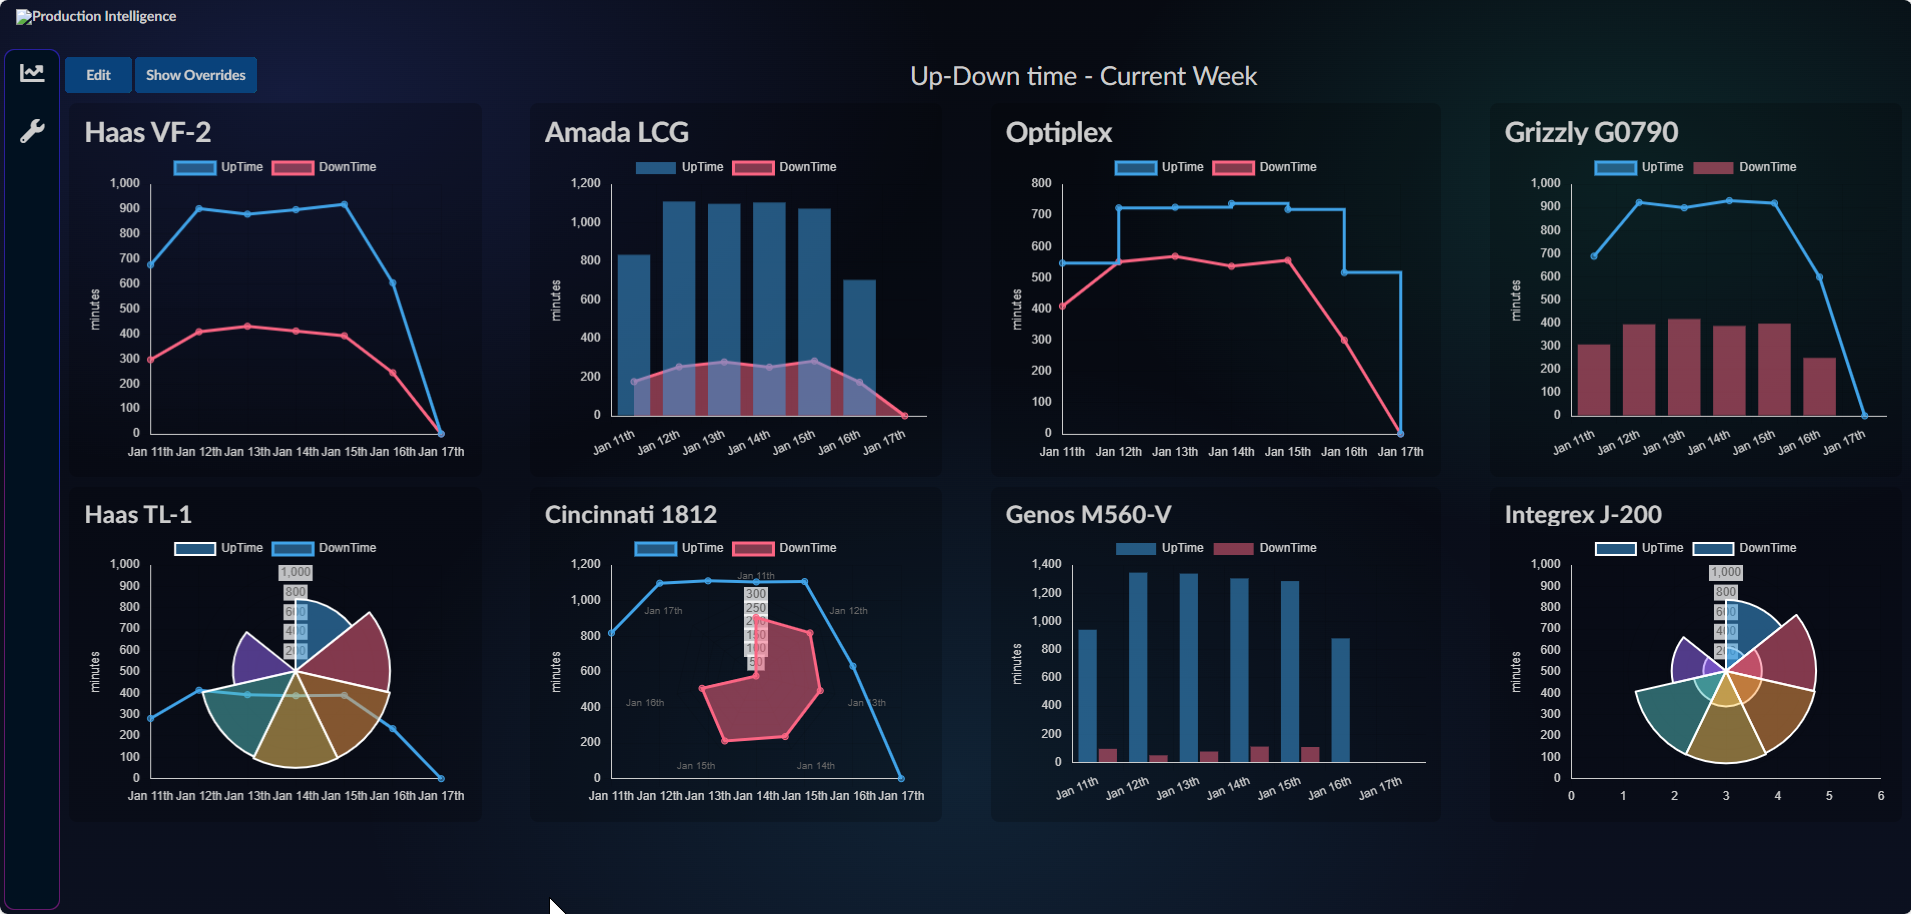
Dynamic dashboards
Rapid dashboard creation with machine and time-range overrides on every view, so each dashboard becomes a flexible lens instead of a static report.
Fast reporting and export
Users can move from live view to usable data quickly, with direct export from dashboard context and faster creation of stakeholder-specific reporting.
Advanced charting
Supports richer visual analysis, including radar and polar chart options, alongside more traditional trend, pareto, and comparative operational views.
Real-world operational modeling
Supports multi-operator assignment, fractional labor, parallel operations, and more accurate representation of how work is actually executed on the floor.
Database cost advantage
Built on PostgreSQL, eliminating the extra licensing burden that often comes with Microsoft SQL Server-based deployments.
Path to governance
PI improves visibility immediately and becomes the operational signal foundation that MERIT 2.0 uses to enforce accountability, escalation, proof, and learning.
Dashboards
From awareness to analysis
PI scales from plant-wide awareness boards to detailed asset drill-downs and comparative trend analysis. The point is not just to show data. It is to make the operation understandable quickly enough to act on it.
What leaders get immediately
Clear visibility into what is running, what is waiting, where time is being lost, and how the shift is trending against expectation.
What teams can do next
Investigate performance patterns, isolate problem areas, export supporting data, and translate operational signals into specific follow-up actions.
Operator experience
Modern access without portal friction
PI uses a web-based operator experience to reduce deployment complexity while making shop-floor interaction easier to roll out and maintain.
Web-based operator portal
- No heavy client deployment burden
- Simpler access across the plant
- Cleaner fit for modern production environments
- Easier support and rollout compared with legacy portal models
Designed for usability
- Dark-theme interface that is easier on the eyes
- Consistent visual language from awareness board to deep dive
- Fast interpretation for operators, supervisors, and managers
- Ready for TVs, desktops, and control-room style display usage
Integration
Built to become your manufacturing intelligence hub
PI is built to integrate with the systems that shape execution, so operational reality can be represented in context and expanded over time.
Machine connectivity
Collects real-time signals from equipment and automated cells to establish trustworthy operational status, production counts, and timeline context.
ERP linkage
Supports richer labor accuracy, work-order context, inventory interaction, and reporting back to enterprise systems using the right operational model.
Quality and maintenance context
Extends visibility by incorporating control plans, inspections, maintenance tasks, and related events that affect readiness and performance.
Foundation for MERIT 2.0
The same integrated operational signals become the raw material for governed work, gates, escalation, proof, and learning in the broader MERIT 2.0 platform.
Roadmap advantage
Visibility today. Governance tomorrow.
PI is the better intelligence layer and the on-ramp to governance.
| What the plant needs | Delivered by PI | Extended by MERIT 2.0 |
|---|---|---|
| Live operational visibility | Real-time dashboards, trends, and context | Used as input for governed decision-making |
| Actionable exceptions | Signals, thresholds, and surfaced issues | Ownership, SLA clocks, and escalations |
| Execution discipline | Insight into what is happening | Gates, holds, proof, verification, and closure rules |
| Organizational learning | Patterns and repeat issues become visible | Corrective action and forced standard updates |
“Production Intelligence gives you flexibility, usability, cost efficiency, and accuracy now. MERIT 2.0 turns that operational truth into full governance when you are ready.”
Technology
Modern stack. Manufacturing-ready architecture.
Production Intelligence is engineered for responsive, scalable deployments with a technology foundation that supports long-term product growth and enterprise reliability.
Technical highlights
- Built on the latest .NET runtime and tooling
- Written in C# for maintainability and clear domain modeling
- Designed for real-time dashboards and evolving integrations
- PostgreSQL foundation to reduce licensing overhead
Business impact
- Lower friction for deployment and growth
- Faster adaptation to plant-specific reporting needs
- Cleaner path from monitoring to enterprise operational control
- Better fit for manufacturers who expect flexibility, not rigidity
Next step
Want a landing page that sells the whole path clearly?
Use PI to show immediate value in visibility, flexibility, and operational truth. Then position MERIT 2.0 as the next layer for enforcement, governed action, and continuous operational control.
See the operation clearly.
Adapt fast.
Build toward real control.
TSRB Production Intelligence gives manufacturers faster, more flexible, and more accurate operational visibility. It turns machine, labor, routing, and production signals into dynamic dashboards and actionable intelligence—then creates a direct path to MERIT 2.0 for full operational governance.
Positioning
PI and MERIT 2.0 each have a distinct role
Production Intelligence is the visibility and intelligence layer. MERIT 2.0 is the control, enforcement, and governance layer. That distinction makes the story stronger: PI solves the need for fast, flexible insight today, while preparing the plant for closed-loop operational governance tomorrow.
Production Intelligence
- Real-time machine, labor, and production visibility
- Dynamic dashboards and fast custom reporting
- Flexible modeling for real-world manufacturing complexity
- Broad integration across ERP, QMS, maintenance, and custom systems
MERIT 2.0
- Governed work queues, ownership, and escalation
- Hard gates, holds, proof, and verification logic
- Corrective action and learning-loop enforcement
- Closed-loop operational governance across functions
Core strengths
Why Production Intelligence stands apart
PI is designed to reflect how shops actually run: changing conditions, mixed resources, shifting priorities, parallel work, and stakeholders who need answers now—not tomorrow.
Dynamic dashboards
Rapid dashboard creation with machine and time-range overrides on every view, so each dashboard becomes a flexible lens instead of a static report.
Fast reporting and export
Users can move from live view to usable data quickly, with direct export from dashboard context and faster creation of stakeholder-specific reporting.
Advanced charting
Supports richer visual analysis, including radar and polar chart options, alongside more traditional trend, pareto, and comparative operational views.
Real-world operational modeling
Supports multi-operator assignment, fractional labor, parallel operations, and more accurate representation of how work is actually executed on the floor.
Database cost advantage
Built on PostgreSQL, eliminating the extra licensing burden that often comes with Microsoft SQL Server-based deployments.
Path to governance
PI improves visibility immediately and becomes the operational signal foundation that MERIT 2.0 uses to enforce accountability, escalation, proof, and learning.
Dashboards
From awareness to analysis
PI scales from plant-wide awareness boards to detailed asset drill-downs and comparative trend analysis. The point is not just to show data. It is to make the operation understandable quickly enough to act on it.
What leaders get immediately
Clear visibility into what is running, what is waiting, where time is being lost, and how the shift is trending against expectation.
What teams can do next
Investigate performance patterns, isolate problem areas, export supporting data, and translate operational signals into specific follow-up actions.
Operator experience
Modern access without portal friction
PI uses a web-based operator experience to reduce deployment complexity while making shop-floor interaction easier to roll out and maintain.
Web-based operator portal
- No heavy client deployment burden
- Simpler access across the plant
- Cleaner fit for modern production environments
- Easier support and rollout compared with legacy portal models
Designed for usability
- Dark-theme interface that is easier on the eyes
- Consistent visual language from awareness board to deep dive
- Fast interpretation for operators, supervisors, and managers
- Ready for TVs, desktops, and control-room style display usage
Integration
Built to become your manufacturing intelligence hub
PI is built to integrate with the systems that shape execution, so operational reality can be represented in context and expanded over time.
Machine connectivity
Collects real-time signals from equipment and automated cells to establish trustworthy operational status, production counts, and timeline context.
ERP linkage
Supports richer labor accuracy, work-order context, inventory interaction, and reporting back to enterprise systems using the right operational model.
Quality and maintenance context
Extends visibility by incorporating control plans, inspections, maintenance tasks, and related events that affect readiness and performance.
Foundation for MERIT 2.0
The same integrated operational signals become the raw material for governed work, gates, escalation, proof, and learning in the broader MERIT 2.0 platform.
Roadmap advantage
Visibility today. Governance tomorrow.
PI is the better intelligence layer and the on-ramp to governance.
| What the plant needs | Delivered by PI | Extended by MERIT 2.0 |
|---|---|---|
| Live operational visibility | Real-time dashboards, trends, and context | Used as input for governed decision-making |
| Actionable exceptions | Signals, thresholds, and surfaced issues | Ownership, SLA clocks, and escalations |
| Execution discipline | Insight into what is happening | Gates, holds, proof, verification, and closure rules |
| Organizational learning | Patterns and repeat issues become visible | Corrective action and forced standard updates |
“Production Intelligence gives you flexibility, usability, cost efficiency, and accuracy now. MERIT 2.0 turns that operational truth into full governance when you are ready.”
Technology
Modern stack. Manufacturing-ready architecture.
Production Intelligence is engineered for responsive, scalable deployments with a technology foundation that supports long-term product growth and enterprise reliability.
Technical highlights
- Built on the latest .NET runtime and tooling
- Written in C# for maintainability and clear domain modeling
- Designed for real-time dashboards and evolving integrations
- PostgreSQL foundation to reduce licensing overhead
Business impact
- Lower friction for deployment and growth
- Faster adaptation to plant-specific reporting needs
- Cleaner path from monitoring to enterprise operational control
- Better fit for manufacturers who expect flexibility, not rigidity
Next step
Want a landing page that sells the whole path clearly?
Use PI to show immediate value in visibility, flexibility, and operational truth. Then position MERIT 2.0 as the next layer for enforcement, governed action, and continuous operational control.